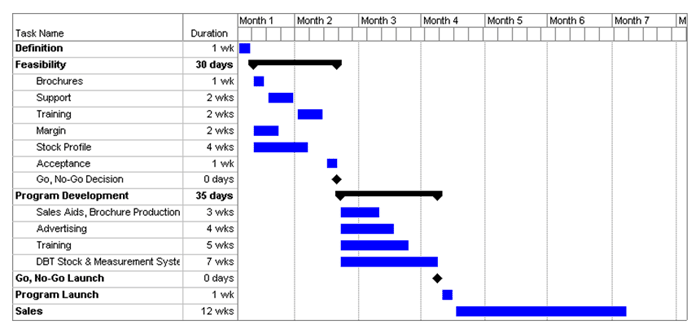
Gantt
Chart for the New Product Launch Project:
In the WBS lesson, we saw a WBS for a New Product Launch
project. This is the accompanying Gantt Chart. The indented
list on the left is the WBS List. The solid black lines with
triangles at each end represent summary level (roll-up) tasks.
The blue bars represent the active tasks scheduled across
the project life cycle.
|