Gantt
Charts
The most familiar visual representation of a project schedule
is the Gantt Chart. In the Gantt Chart, bars are stretched
across a timeline to represent when a task is planned for
work. Remember, the fundamental purpose of scheduling is
to communicate, and a simple Gantt Chart is an excellent
communication tool.
A Simple Gantt Chart:
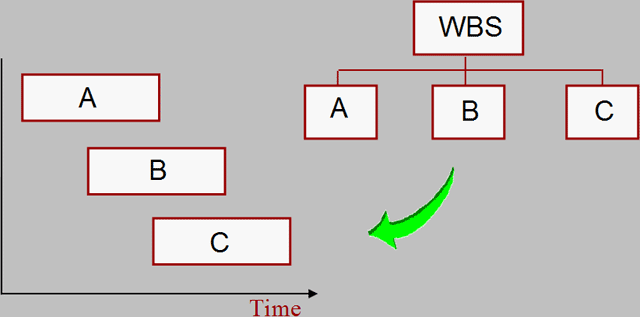
Here is a Gantt Chart that translates the top level of a
WBS into a schedule. Notice the communication value of
this simple
chart. 
An Important
Note: The shape of the rectangular
bars on a Gantt Chart visually suggest that the level of work
is also even across the period of performance. This is simply
a visual illusion. The amount of work may or may not be scheduled
evenly across the length of the bar. |

