Gantt
Charts as Management Reports:
Showing progress on the Gantt
Chart
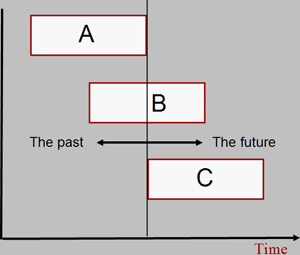
One of the benefits of the Gantt Chart is that it gives you a simple
way to depict project status. In the diagram, a vertical line is
drawn to represent the status date. All work to the left of the line
should be complete, work to the right of the line is planned for the
future.
This simple visual representation of schedule
and status immediately highlights any exceptions.
Guidelines for Management Reports
- Report by
exception
- Standardize the report format
- Report variations
from the baseline
- Freeze the baseline
|